BlockBlock: A Complete Blockchain Data Analytics Platform

BlockBlock: Architecting a Real-Time Ethereum Data Analytics and Monitoring Platform
Project Overview
BlockBlock is a comprehensive, end-to-end platform for Ethereum blockchain data analytics and monitoring. Developed as a single monorepo, it integrates all the necessary components—from blockchain node access and real-time data streaming to storage, monitoring, and user-facing applications—to create a complete, extensible environment.
The core challenge was to construct a robust, high-performance architecture capable of reliably processing the vast and continuous stream of data from the Ethereum network for research, audit, and operational insights. The entire platform is orchestrated via Docker Compose, ensuring a reproducible environment for local development and deployment.
Architecture and Data Pipeline 🌉
The platform's architecture is a testament to modern distributed systems design, combining specialized tools for each layer of the data lifecycle.

Blockchain Data Source
To ensure complete and historical data access, BlockBlock utilizes two primary Ethereum nodes:
- Geth (Execution Layer): Running as an archive node, Geth stores the entire blockchain history, including the state at every block, which is crucial for in-depth analytics and querying historical account balances or contract states.
- Prysm (Consensus Layer): This component is a full beacon node implementation and client for Ethereum's Proof-of-Stake consensus mechanism, ensuring access to the latest consensus-related data.
Real-Time Data Streaming with Kafka
The Data Pipeline uses Kafka and Zookeeper to handle the high-volume, real-time data stream from the Ethereum nodes.
- Kafka serves as a high-throughput, fault-tolerant distributed event streaming platform. A dedicated Python service streams Ethereum block headers from Geth directly into Kafka.
- This structure allows for the decoupling of data producers and consumers, enabling multiple downstream services (like TimescaleDB or future analytical connectors) to subscribe to the same data stream independently and process records in parallel.
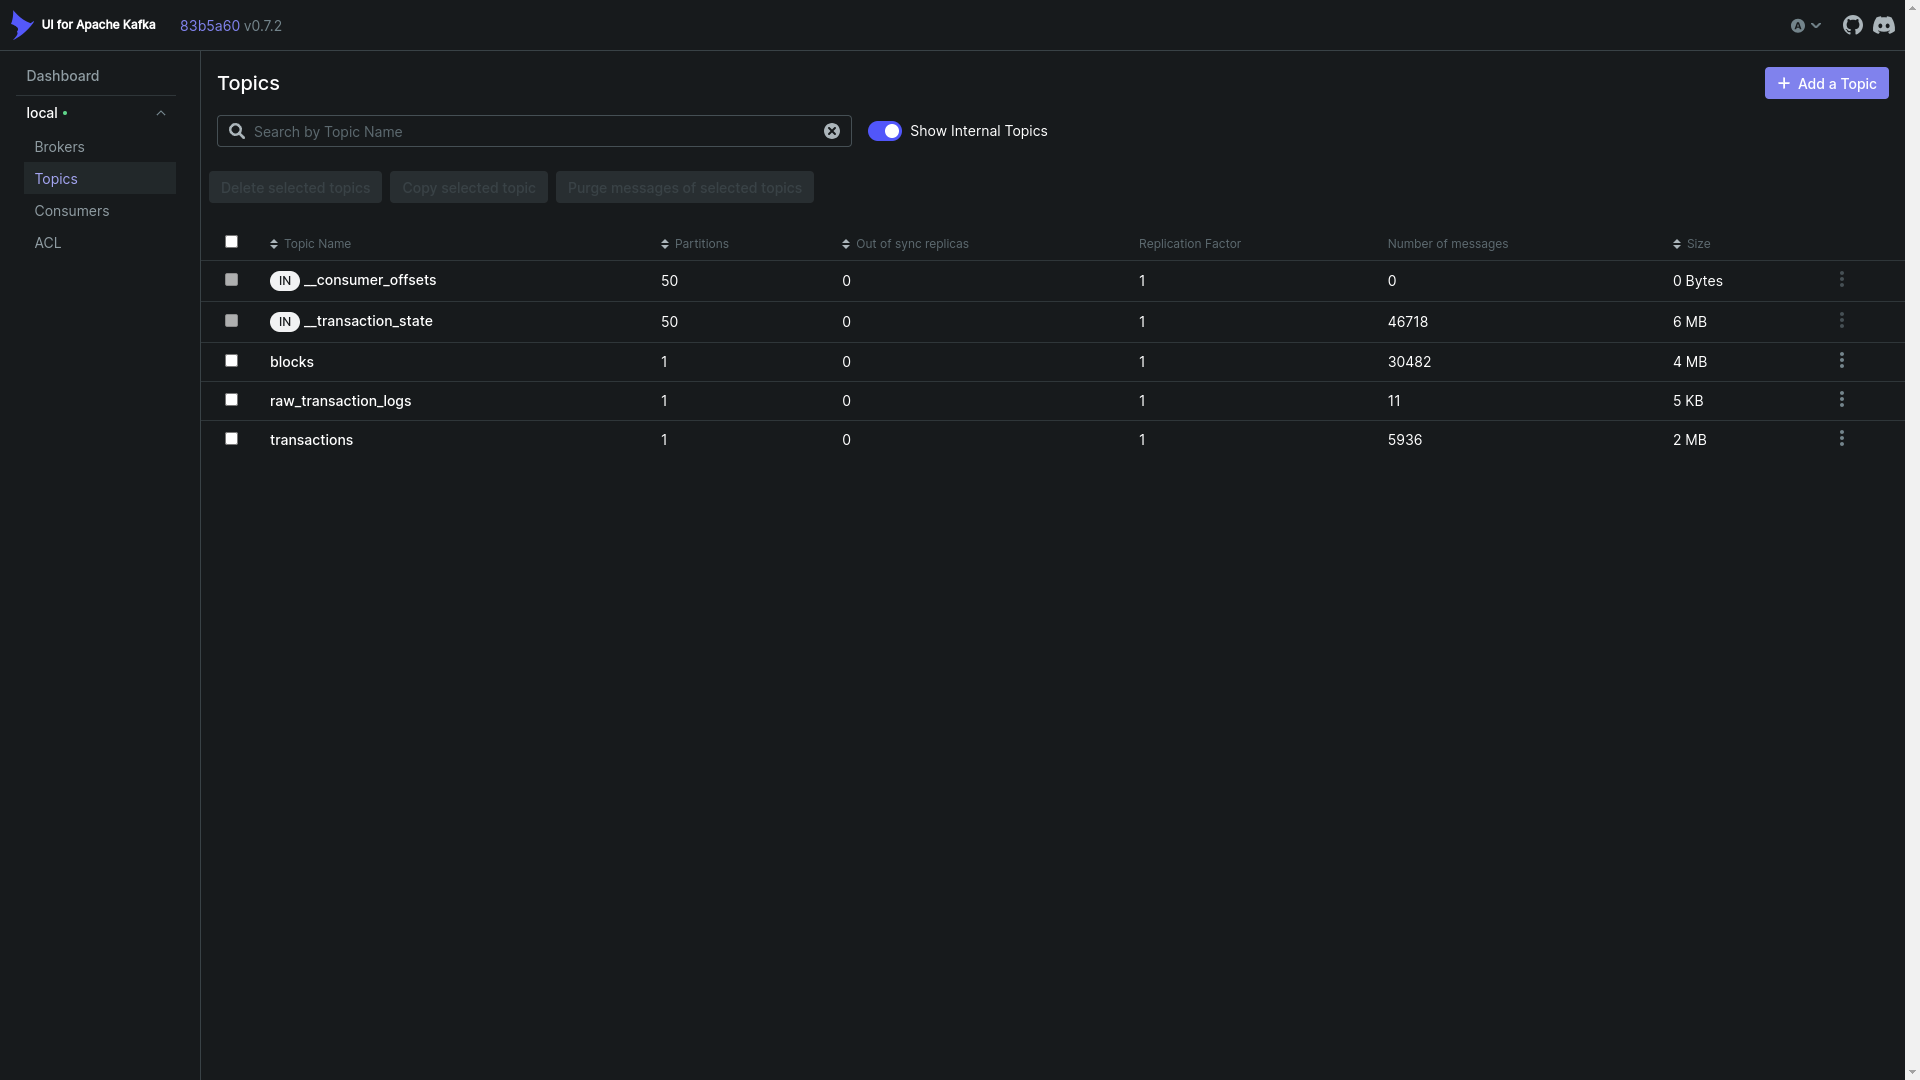
Kafka UI Topics View:
This Kafka UI interface displays active topics in the BlockBlock data streaming layer, showing five topics:__consumer_offsets,__transaction_state,blocks(30,482 messages, 4 MB),raw_transaction_logs(11 messages, 5 KB), andtransactions(5,936 messages, 2 MB). Each topic shows partition count, replication factor, sync status, and size metrics, providing real-time monitoring of blockchain data flowing through the Kafka streaming pipeline.
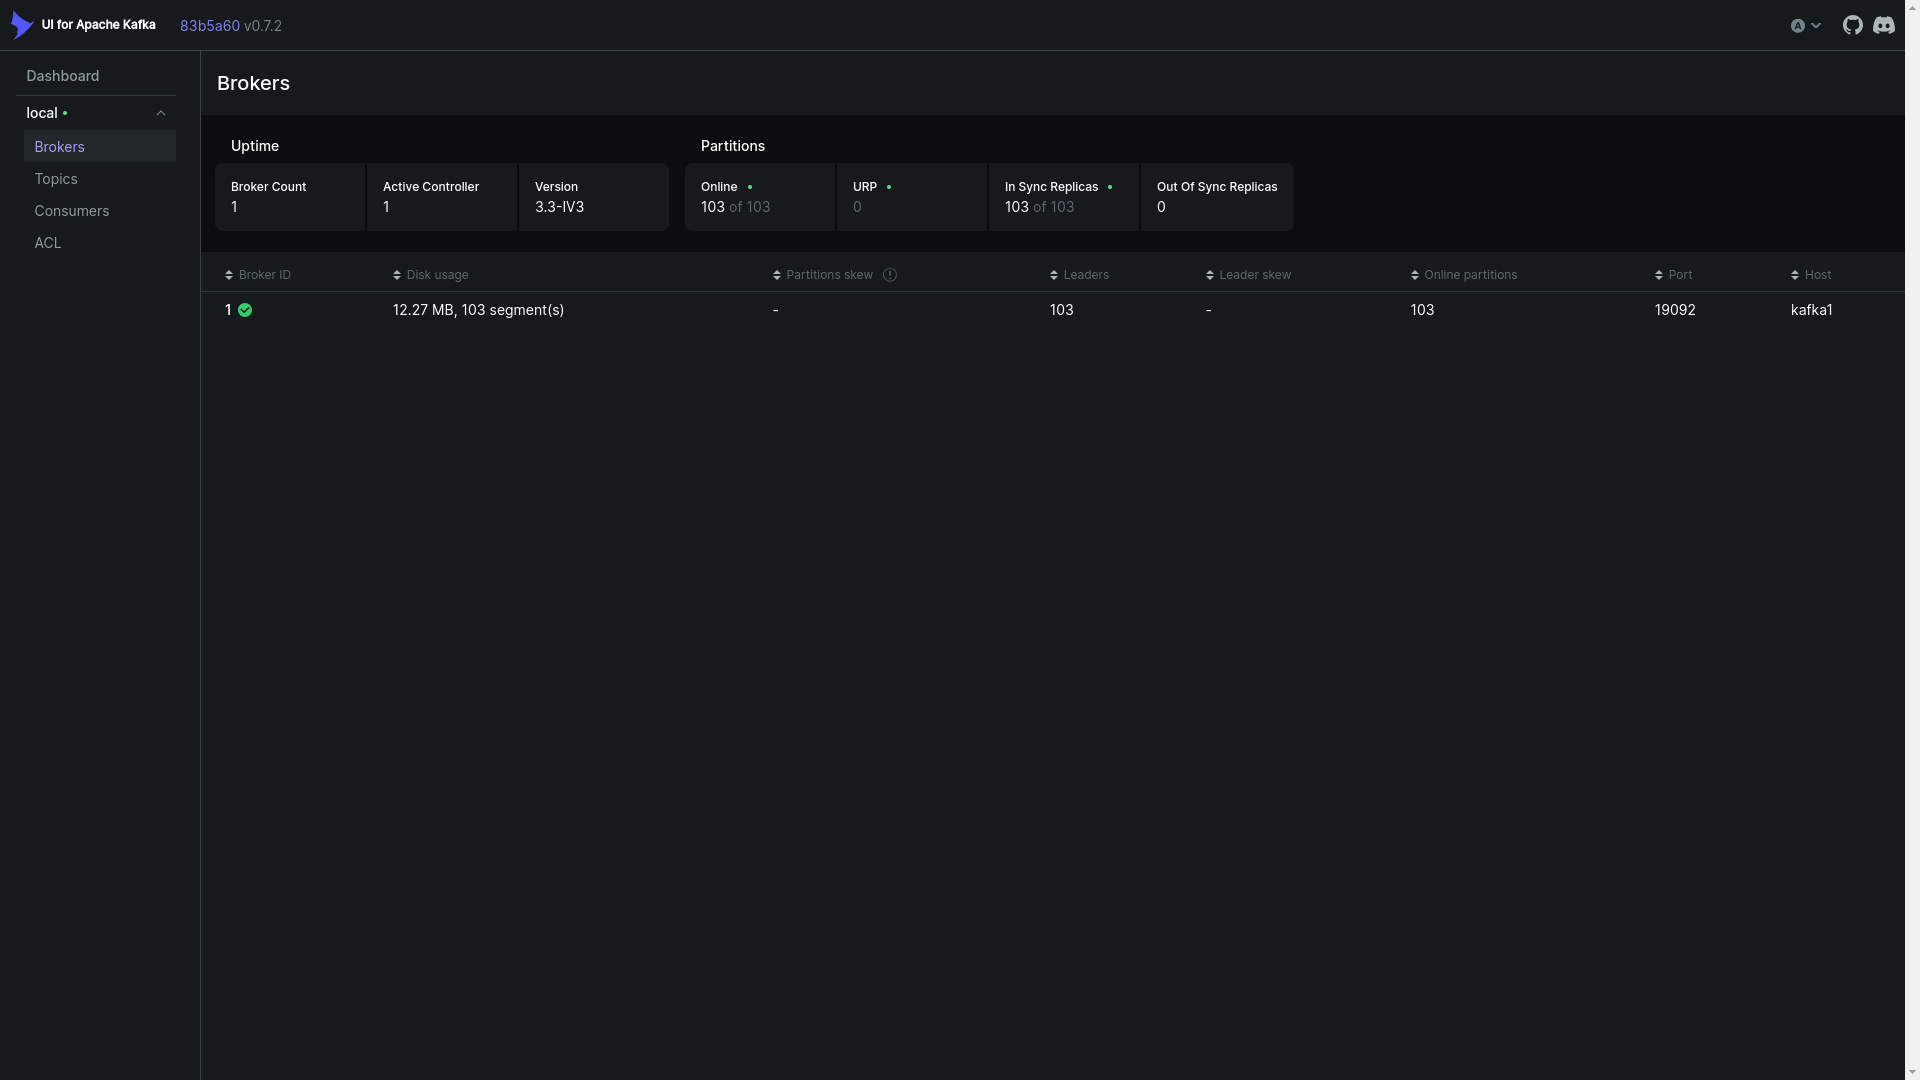
Kafka UI Broker View:
The broker dashboard displays the health of the Kafka cluster, showing one active broker (version 3.3-IV3) with 103 online partitions, 12.27 MB disk usage across 103 segments, and all replicas in sync. The broker operates on port 19092, providing real-time monitoring of the message streaming infrastructure within the BlockBlock data pipeline.
Time-Series Data Persistence (TimescaleDB)
For persistent storage and high-speed analytical querying, TimescaleDB is used to store both source and destination data.
- TimescaleDB is a powerful PostgreSQL extension optimized for time-series data. Blockchain transaction and block data is inherently time-series, making TimescaleDB an ideal choice for efficiently ingesting, storing, and performing real-time analytics on the continuous stream of blockchain events.
Full-Stack Implementation
Application Layer
The platform includes a robust application stack:
- Django Backend: Provides the REST API for blockchain analytics and management.
- Next.js Frontend: A web application for users to explore and visualize the processed blockchain data.
- Nginx Proxy: Acts as a proxy, routing traffic to the frontend and backend services while providing SSL support for secure communication.
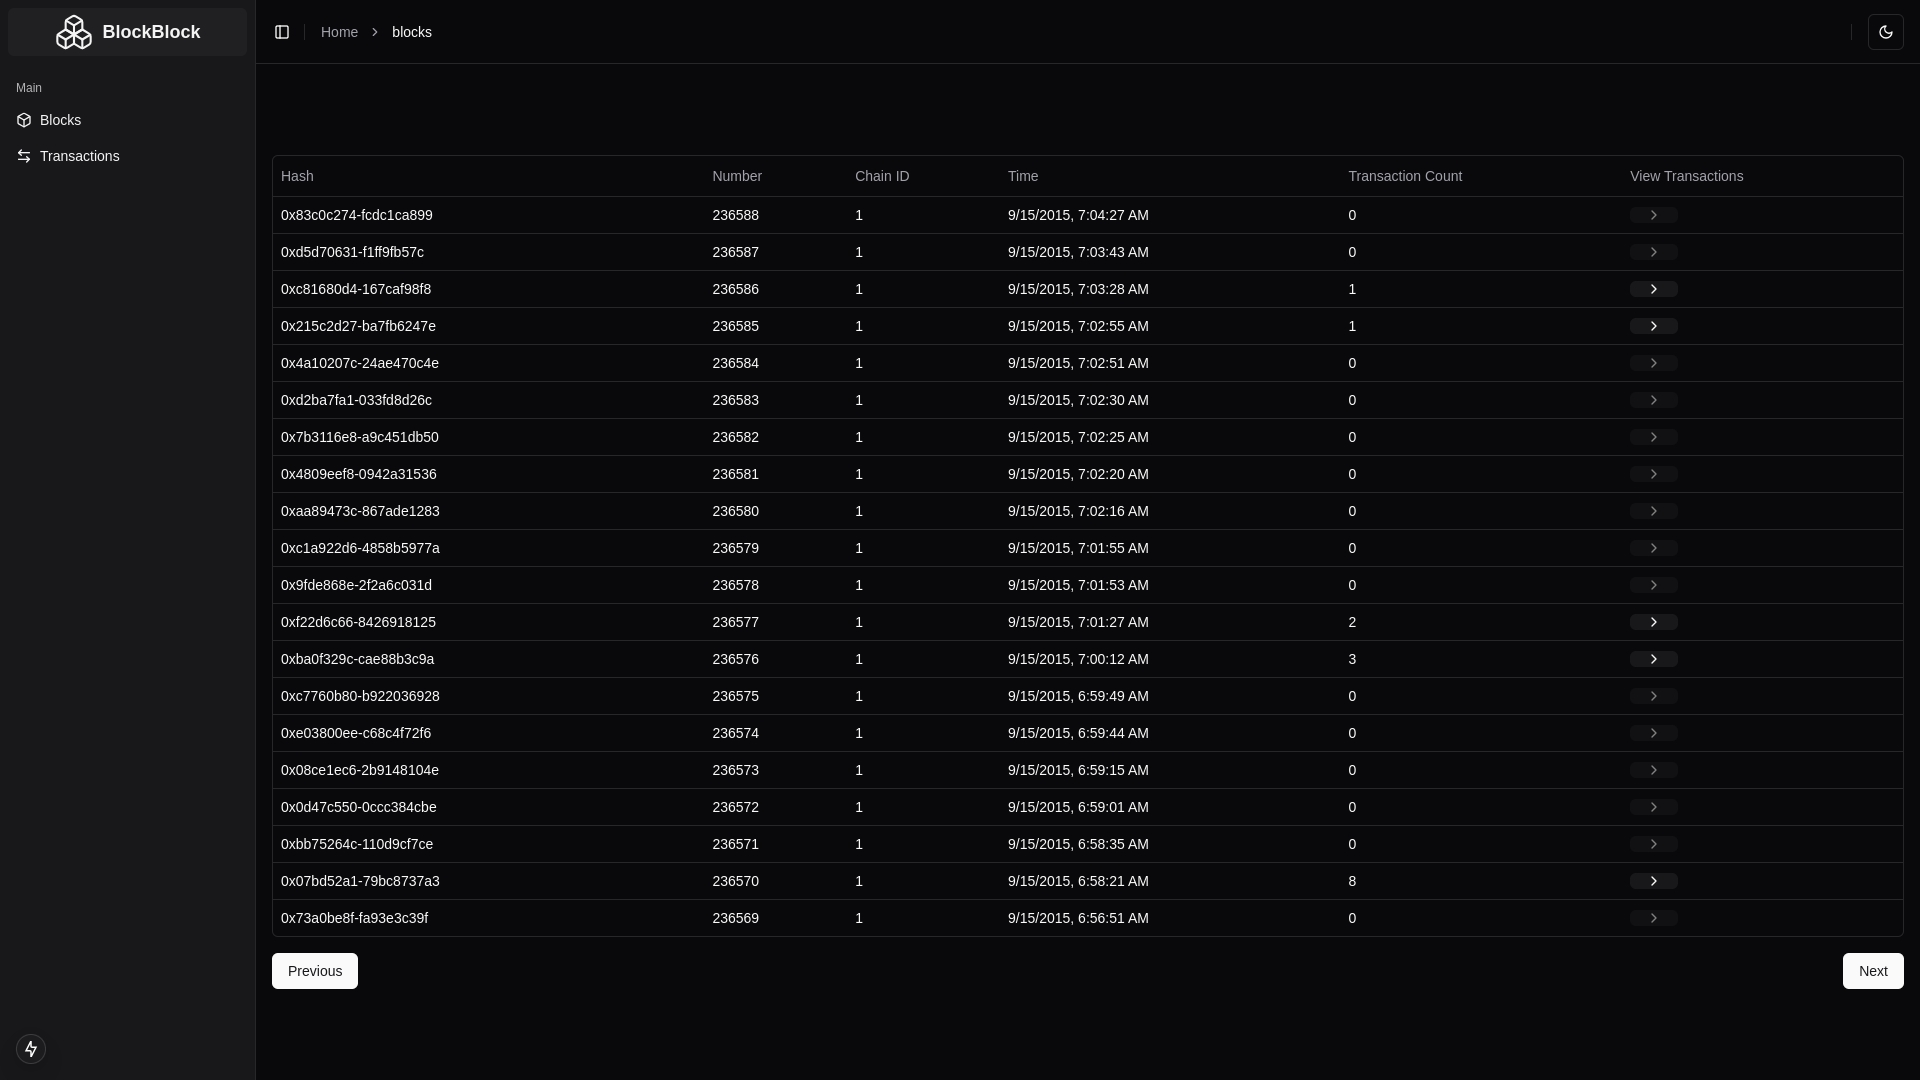
BlockBlock Frontend Blocks Explorer Page:
This Next.js frontend interface displays a paginated list of Ethereum blocks, showing block hash, number, chain ID, timestamp, and transaction count. The table presents blocks from the BlockBlock blockchain explorer, ranging from block 236569 to 236588, with timestamps from September 15, 2015. Users can navigate through pages and click to view detailed transaction information for each block, providing an intuitive exploration experience.
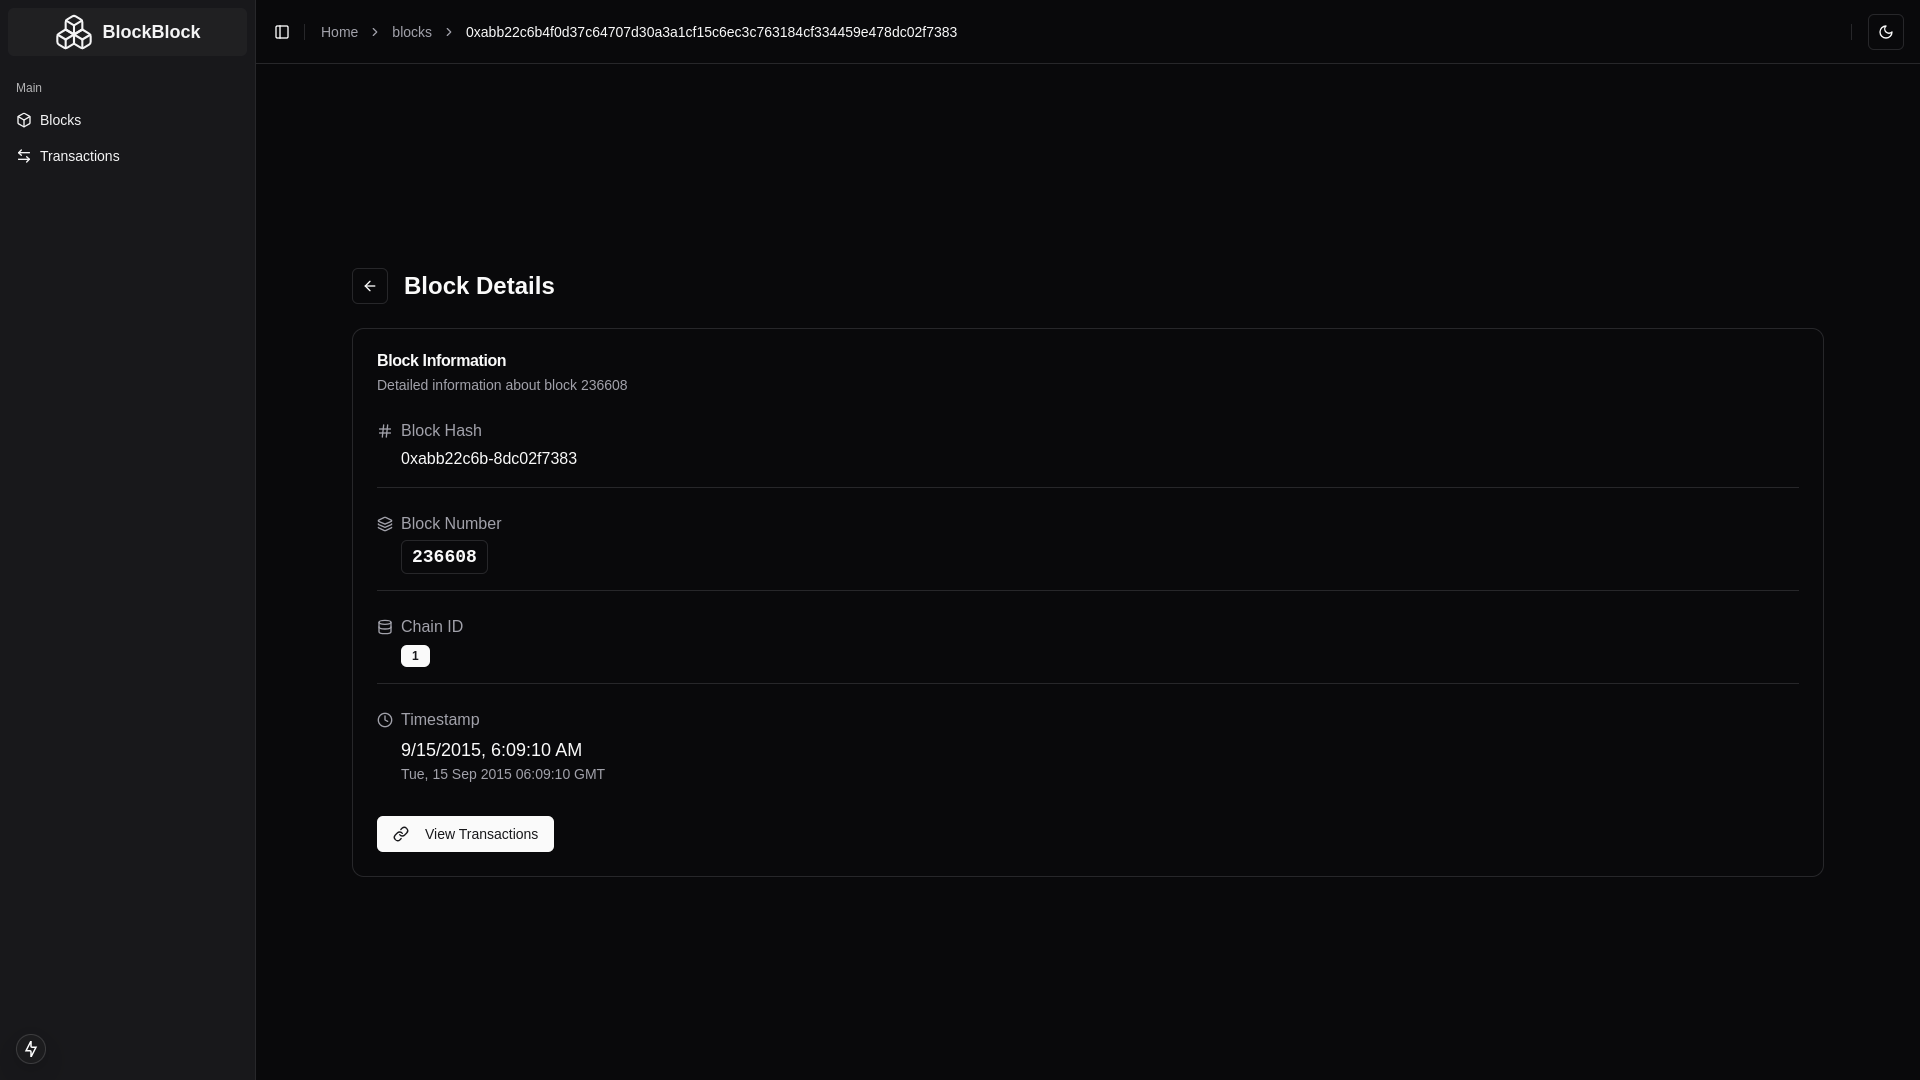
BlockBlock Block Details View (Frontend):
This Next.js detail page displays comprehensive information for Ethereum block 236608, including its hash (0xabb22c6b-8dc02f7383), block number, chain ID (1), and timestamp (9/15/2015, 6:09:10 AM). The interface provides a clean, card-based layout with a "View Transactions" button for exploring block contents, demonstrating the BlockBlock platform's user-friendly blockchain data exploration capabilities.
BlockBlock Frontend Transactions Explorer Page:
This Next.js interface displays a paginated list of Ethereum transactions, showing transaction hash, index, chain ID, amount in ETH, contract address, recipient address, and associated block hash. The table presents various transaction values ranging from 0.00 ETH to 24,000 ETH, providing users with a comprehensive view of blockchain transaction data stored in the BlockBlock analytics platform.

Connectors and Management
Connectors are services designed to move data between the databases and Kafka topics. The Management Layer provides crucial UI tools:
- Kafka UI: For monitoring and managing the Kafka topics and event streams.
- Adminer: For simple database management of TimescaleDB.
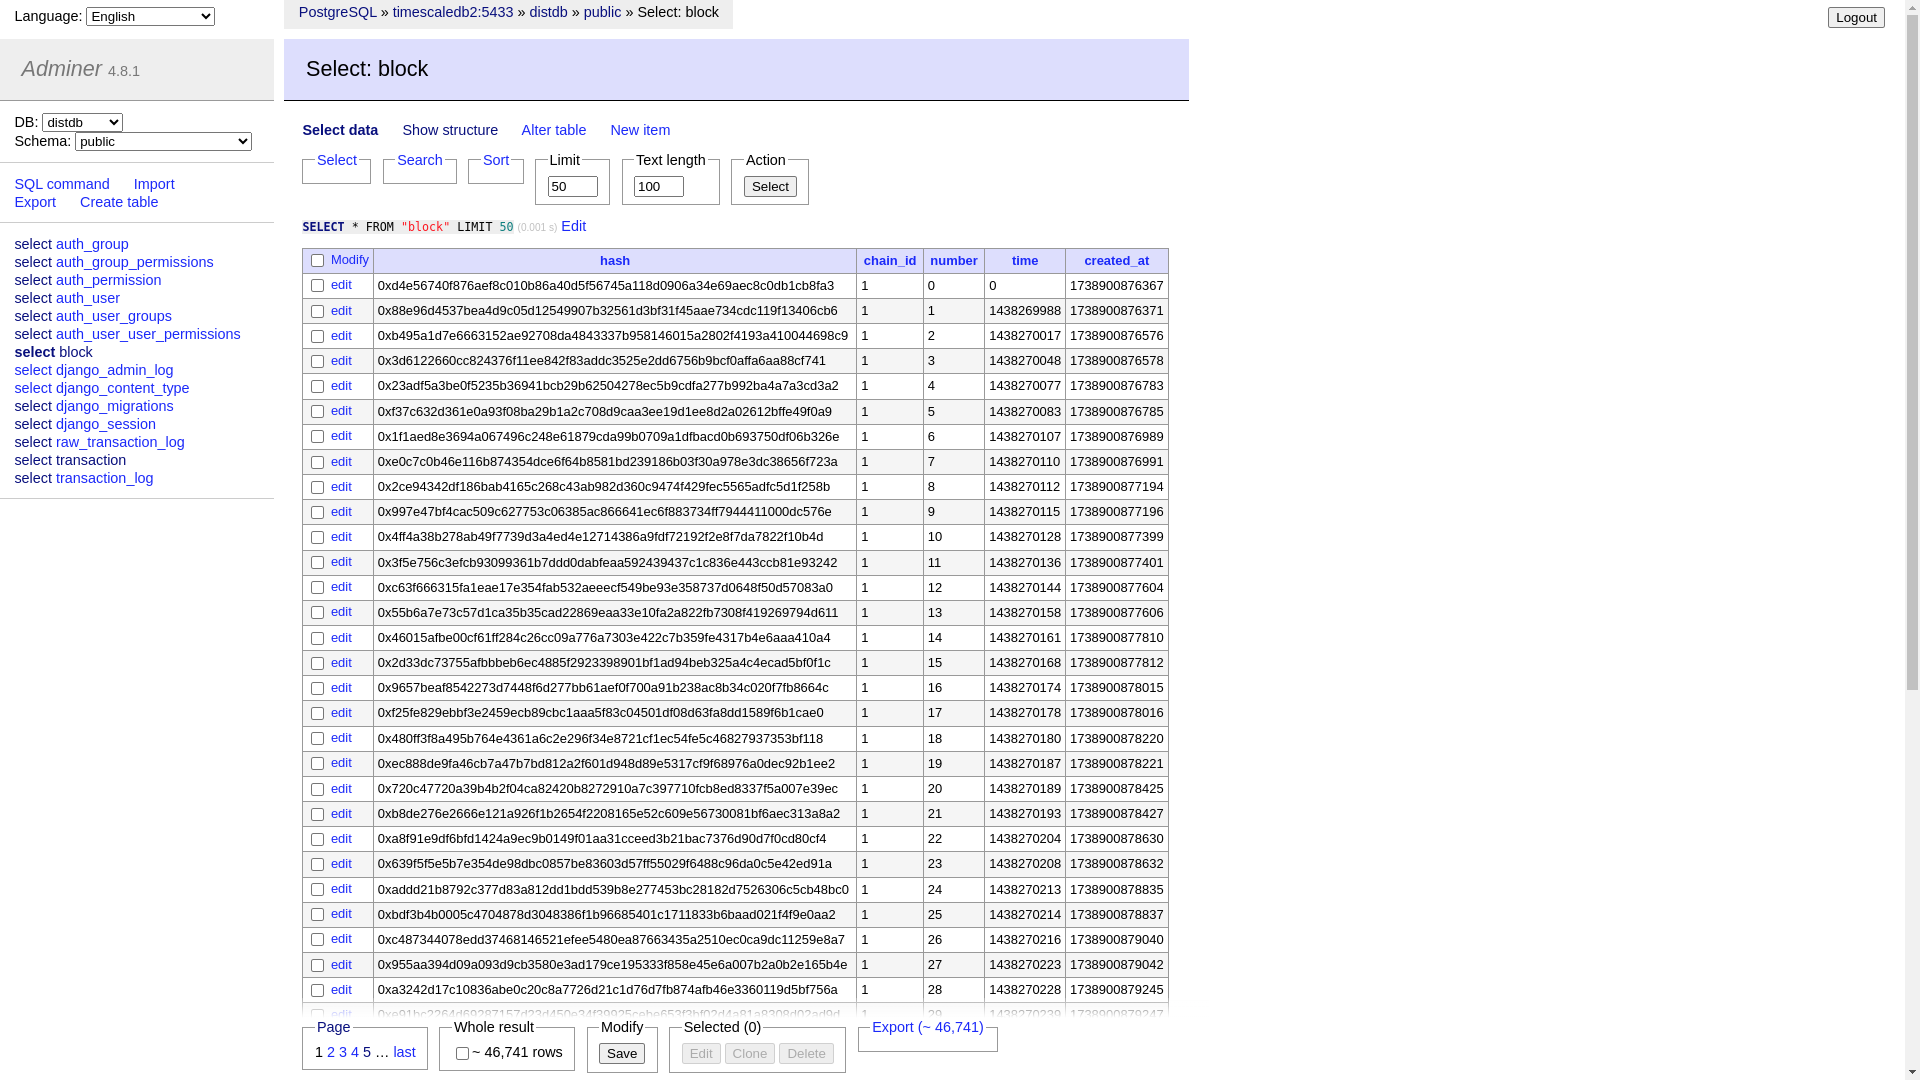
TimescaleDB Block Data Table (Adminer Database Management):
This Adminer interface displays the blockchain block data stored in TimescaleDB, showing the complete block table structure with columns for block hash, chain ID, block number, timestamp, and creation time. The table contains 46,741 rows of Ethereum block records with cryptographic hashes and metadata. This database view is part of the BlockBlock data storage layer, managing synchronized blockchain data collected from Geth and processed through the data pipeline for analytics purposes.
Operational Monitoring with Prometheus and Grafana 📈
A critical component of the platform is the Monitoring Layer, ensuring the health and performance of all services.
- Prometheus: Serves as the time-series monitoring system, collecting metrics from various sources. It is specifically configured to monitor Geth, Docker containers (via cAdvisor), and system metrics (via node-exporter). Geth exposes its metrics via a Prometheus endpoint for scraping.
- Grafana: Provides the visualization and dashboarding layer. It is configured with dashboards and data sources to visualize the metrics collected by Prometheus, offering real-time insights into node sync status, system resource usage, and data pipeline performance.
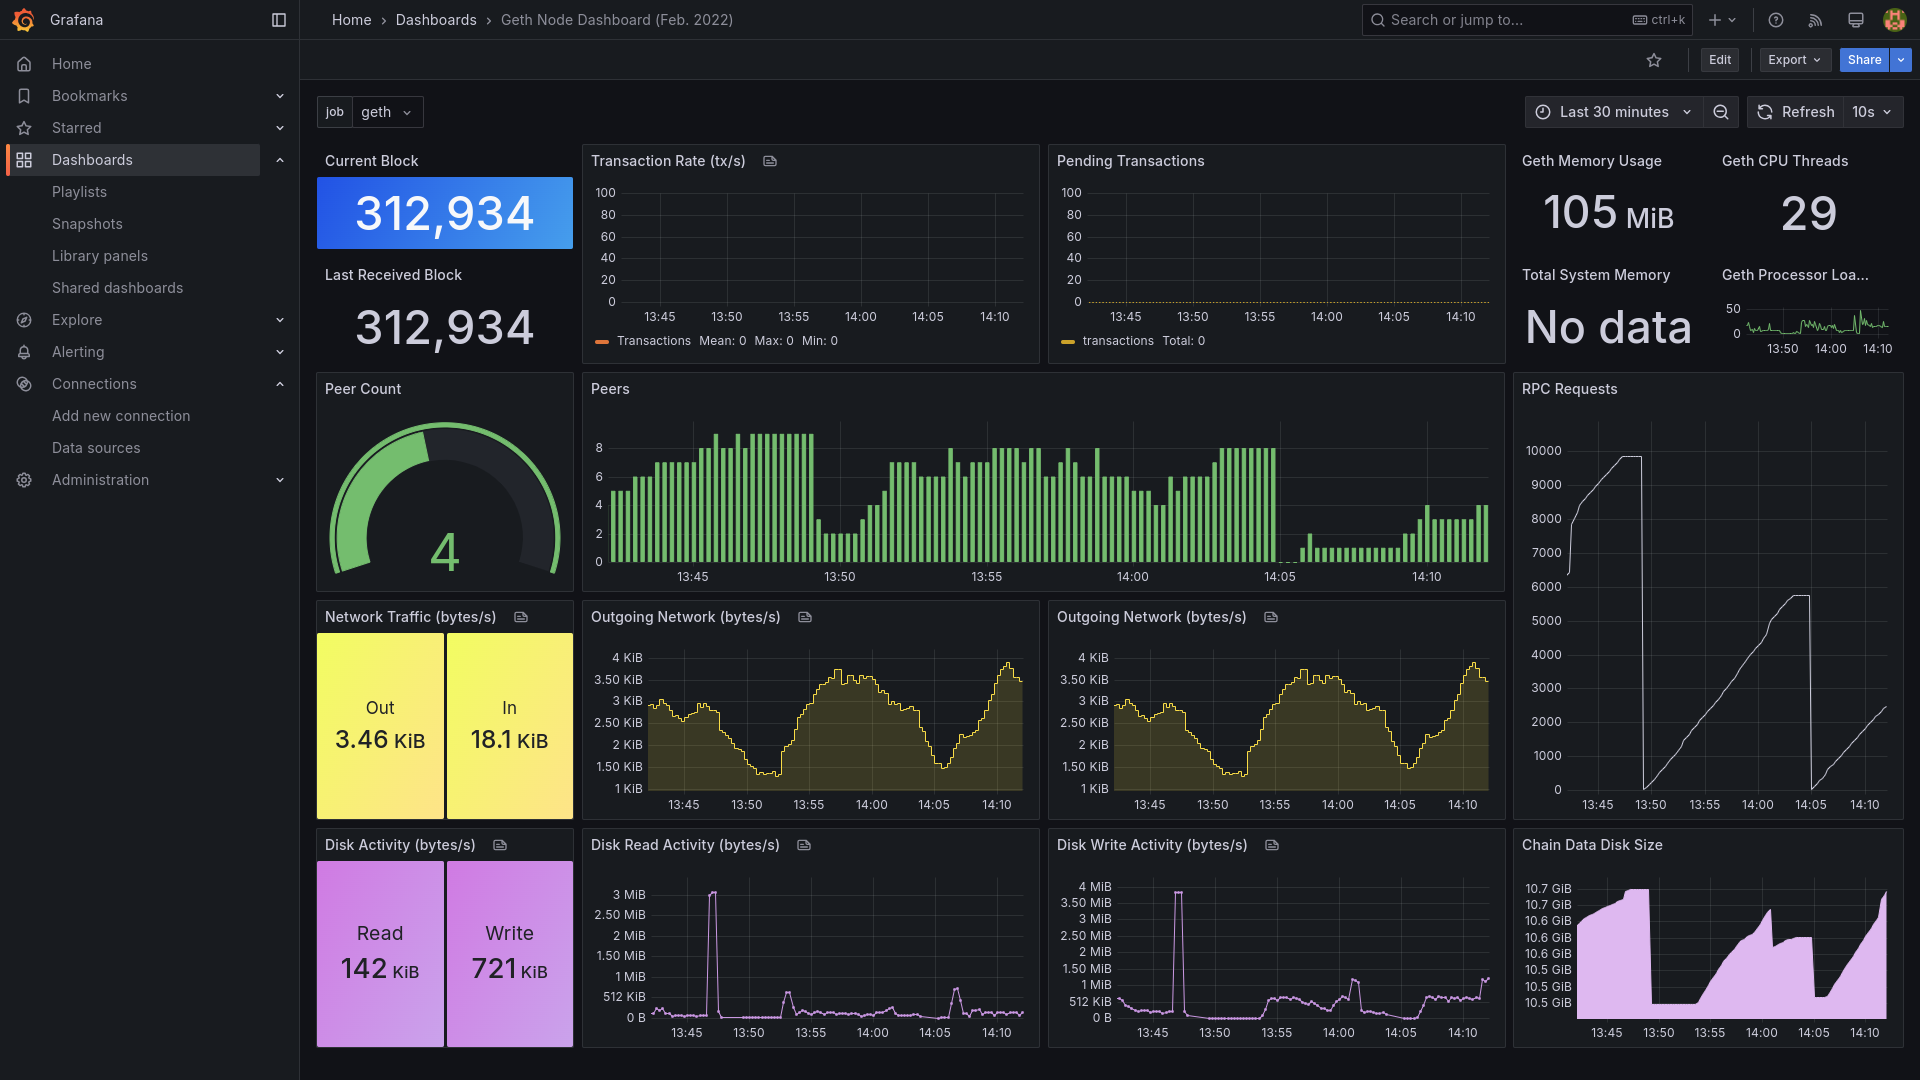
Geth Node Monitoring Dashboard:
This Grafana dashboard visualizes real-time metrics from a running Geth Ethereum node, including block synchronization, peer connectivity, transaction throughput, and system performance.
It displays current and last received blocks, peer count, network I/O, disk activity, and RPC requests collected via Prometheus exporters. The visualization helps monitor node health, synchronization progress, and resource usage, ensuring stable operation within the BlockBlock analytics infrastructure.
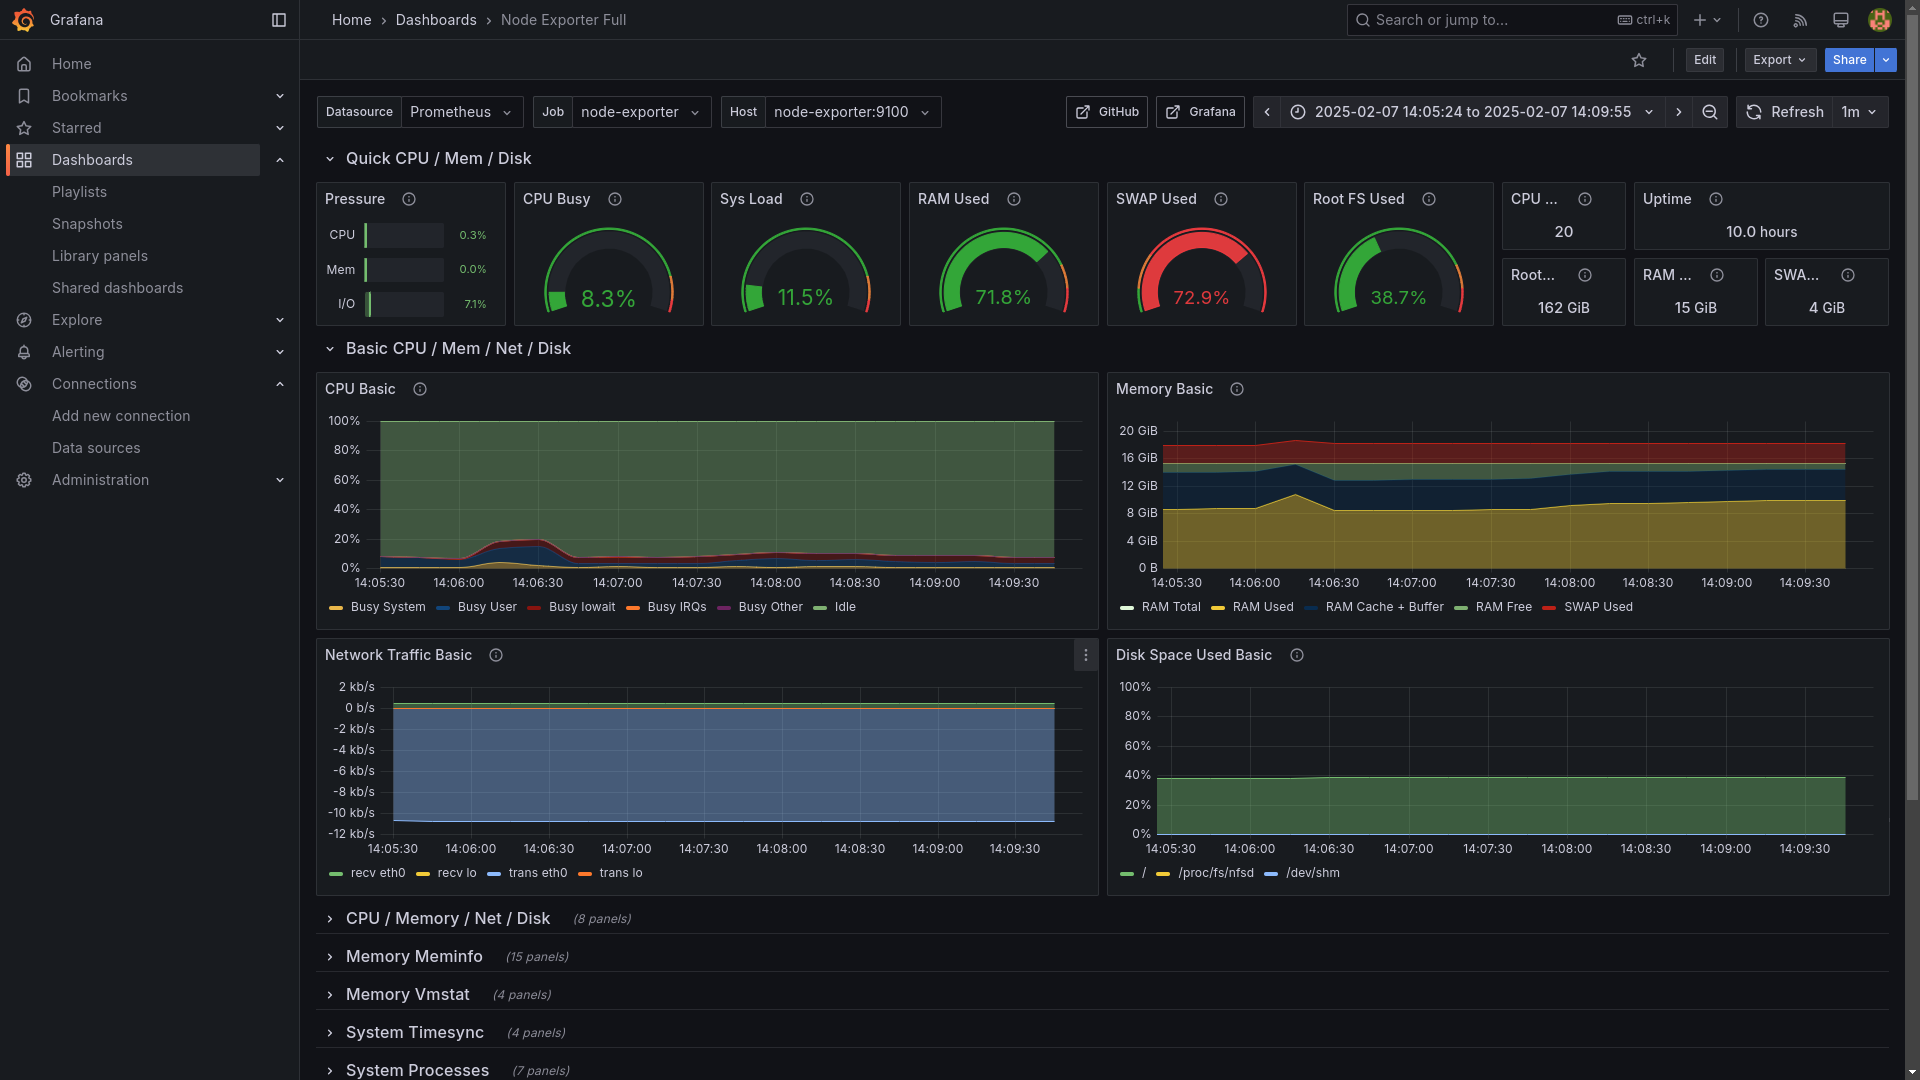
System Resource Monitoring Dashboard:
This Grafana dashboard visualizes real-time system metrics from Node Exporter, including CPU utilization, memory consumption, network traffic, and disk usage. It displays resource pressure indicators, system load, RAM allocation, swap usage, and filesystem capacity collected via Prometheus. The visualization helps monitor server health and resource utilization, ensuring stable infrastructure operation within the BlockBlock analytics platform.
Geth Node Processing Metrics Dashboard:
This Grafana dashboard visualizes real-time metrics from a running Geth Ethereum node, including block synchronization, transaction processing, and performance indicators. It displays latest header (189509), receipt, and block numbers, transaction pool status, chain head progression, and block processing times across various operations (execution, validation, commit, account operations, storage). The visualization helps monitor node health, sync progress, and processing efficiency.

Conclusion
The BlockBlock project demonstrates mastery in full-stack software development, distributed systems architecture, and blockchain-specific data engineering. By successfully integrating and orchestrating complex components like Geth/Prysm nodes, Kafka's streaming capabilities, TimescaleDB's time-series analytics, and a comprehensive monitoring stack, BlockBlock delivers a complete, high-value solution for blockchain data analysis. This experience highlights proficiency in creating scalable, fault-tolerant, and data-intensive platforms.